
Decision making tools
Introduction
In this section of “Decision making tools“, we will provide a comprehensive introduction to all types of Program Logic Development Tools like Algorithms, Decision Trees and Flow Charts that may be very useful in python programming with examples including the following topics
- Algorithm: A Decision Making Tool
- Decision Trees: A Decision Making Tool
- Flowcharts: A Decision Making Tool
- Decision Making Tool Examples
Basically, by the end of this tutorial, you will have a solid understanding of all about Program Logic Development Tools and will be able to use this knowledge in their own programming projects.
Also this tutorial covers all necessary topics/concepts required to complete your exams preparations in CBSE schools / classes 11th and 12th.
Hence, before developing the solution of a problem in terms of a program, you should read and analyze the given problem and decide about basic sub-takes needed to solve a problem and the order of these subtasks. In other words, you figure out the algorithm for the solution of a given problem and represent it through various logic development tools.
Decision making tools in programming
Here is the list of some decision-making tools that can be used in programming:
- Decision tree
A supervised machine learning technique that uses a tree-like model to determine the probability of each outcome.
- Decision matrix
An algorithm that systematically identifies, analyzes, and rates the performance of relationships between sets of values and information.
- Data-driven decision-making
A vital aspect of modern software development that involves collecting, analyzing, and interpreting data.
- Python
A programming language that can be used for real-time business decision making. Python’s data analysis libraries, like Pandas, NumPy, and Matplotlib, can help process, analyze, and visualize data.
- Decision Rules
A SaaS solution that can help digitalize decision-making processes within an organization.
Some other decision-making tools in programming include:
Before learning about different “Decision making tools | Trees and Flow Charts” (Looing and Iterative) statements, first of all, you should know basic tools that will help you decide about the logic to solve a given problem i.e., the algorithm. For this, there are multiple decision making tools like Trees and Flow Charts are available. In the following section, we are going to talk about such tools like Algorithm, decision trees, flow charts, and pseudo-code etc.
Algorithm: A Decision Making Tool
An algorithm is a step-by-step procedure (well- defined instructions) to solve a given problem. For instance, the algorithm to find the remainder of given two numbers is:
- Input first number.
- Input second number.
- Divide first number with second number and store the remainder as third number.
- Display the result (the third number).
Also, An algorithm is a set of ordered and finite steps (the subtasks) to solve a given problem. Consider another example that extends the above problem- using the same logic determine if the first number is divisible by second number or not.
- Input first number
- Enter second number
- Divide first number with second number and store the remainder in third number.
- Check if the third number is 0
- If Yes, Display ‘the first number IS divisible by second number.’
- If No, Display ‘the first number IS NOT divisible by second.’
As you can see that subtasks in above algorithms are shown in bold letters and there is a proper order of carrying out these steps/subtasks. Algorithms are shown in bold letters and there is a proper order of carrying out these steps/subtasks. Algorithms are commonly written out with tools like pseudocode, flow charts, or decision trees and tables.
Here, we shall stick to flowcharts only, as suggested by the syllabus.
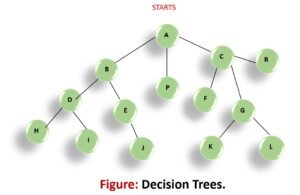
Decision Trees: A Decision Making Tool
In simple terms, decision trees are like computer programs that help make decisions or predictions by asking questions and following a flowchart-like structure.
A good thing about decision trees is that they are easy to understand. They also can handle different types of information.
The program starts with a question at the top, and depending on the answer, it moves to the next question. This continues until it reaches a final answer or prediction.
Trees may be a computer program that helps in making decisions or predictions about the possible solutions of a problem. It works like flowcharts, in which each step is based on certain conditions or factors
Trees are multilevel data structures having a hierarchical relationship among its elements called nodes. Topmost node is called the root of the tree and bottommost nodes are called leaves of the tree. Each of the nodes has some reference-pointers, pointing to (for example storing the reference of) the nodes below it.
Example of decision trees
Let’s consider a simple example of a decision tree used for deciding whether to go for a picnic or not, based on weather conditions.
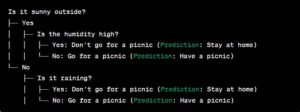
In this example, the decision tree starts with the question, “Is it sunny outside?” If the answer is “Yes,” it moves on to ask about the humidity. If the humidity is high, it suggests staying at home. If the humidity is not high, it predicts that it’s a good time to have a picnic.
If the answer to the first question is “No” (not sunny), it then asks if it’s raining. If it’s raining, the decision tree suggests staying at home. If it’s not raining, it predicts a suitable condition for a picnic.
The decision tree helps make a decision based on the specific conditions at hand. It’s a simple example, but decision trees can handle more complex scenarios with multiple factors and conditions to arrive at predictions or decisions.
Flowcharts: A Decision Making Tool
A flowchart is a graphical representation of an algorithm. A flowchart shows different subtasks with different symbols. following figure shows commonly used flowchart symbols.
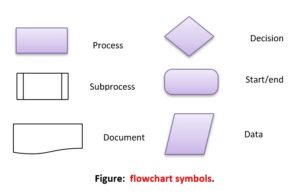
- Data symbol for input /Output (I/O) operation (taking input and showing output).
- Process symbol for any type of computation and internal operations like initialization, calculation etc.
- Subprocess symbol to invoke a procedure written already.
The flowchart for the above algorithm
Determine if the first number is divisible by second number or not
will be:
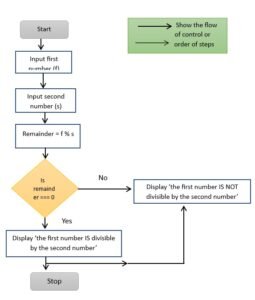
With flowchart, a programmer can pictorially view the subtasks of an algorithm and the order their execution.
You may also like
Malwares: Viruses, Trojans, and Adware | CBSE Class 11

Cyber Crime | CBSE Class 11 | Computer Science